Market Watch
Feature walkthrough — what the system does and how it looks doing it
Enter Demo →The top of the interface encodes the system's operating state at a glance — universe, market status, and auto-trade mode — before a single number is read. Below that, agents and analytics update in real time.
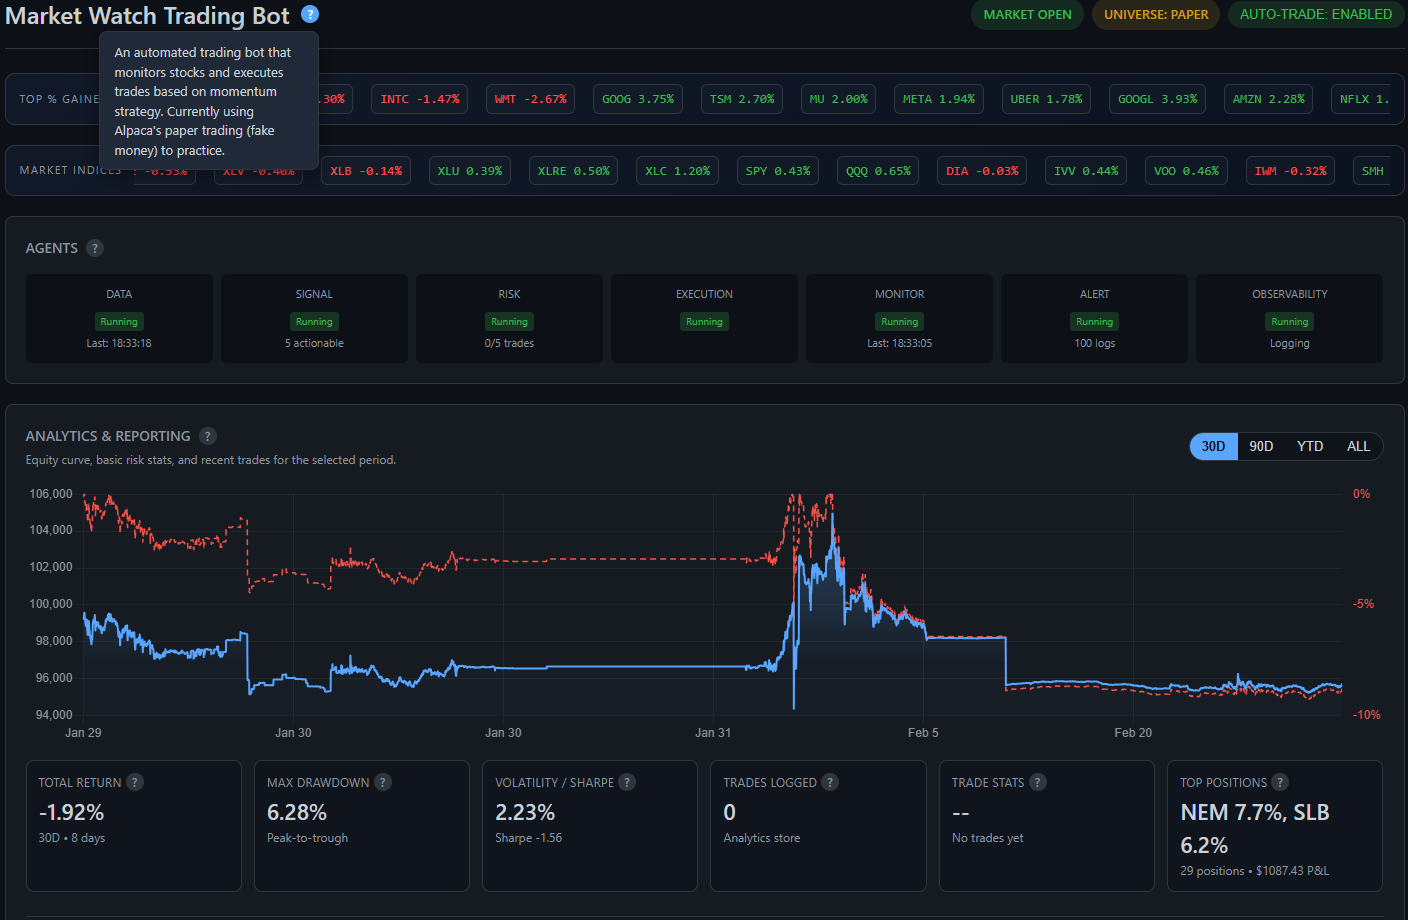
Header status badges encode the three operating invariants: MARKET OPEN (whether the exchange is live), UNIVERSE: PAPER (the execution context — PAPER, LIVE, or SIMULATION — set at construction time and enforced across every subsystem), and AUTO-TRADE: ENABLED (whether the execution pipeline is cleared to submit orders). The agent health row and analytics panel sit immediately below, updating via WebSocket without page refresh.

A scrolling ticker strip shows top % gainers from the current day's momentum scan alongside sector ETF moves (XLF, XLK, XLE, etc.). The Data agent refreshes this every minute during market hours. The gainers list feeds directly into the Signal agent's candidate pool — symbols appearing here are the ones being evaluated for buy conditions.
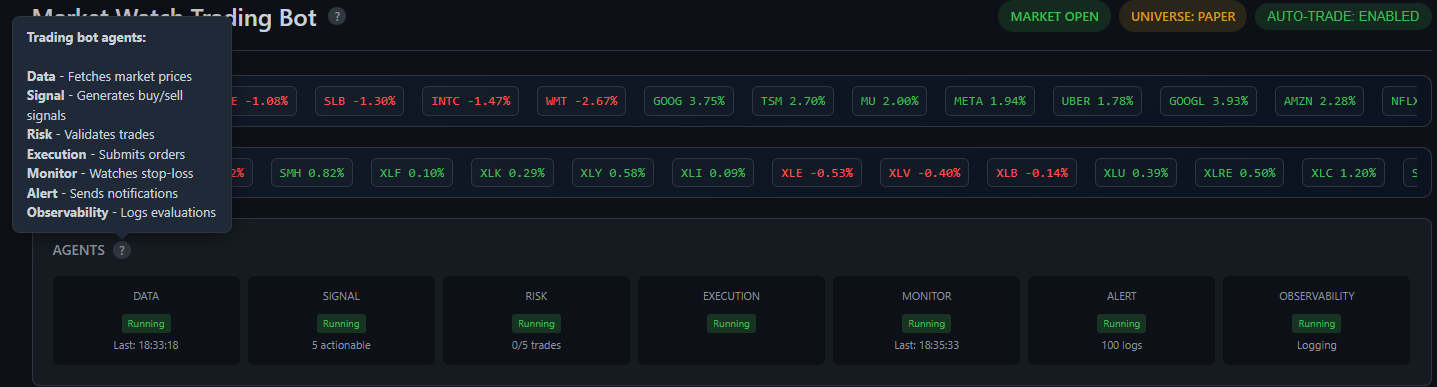
Seven specialized agents run concurrently in independent threads. DATA fetches live market bars from Alpaca. SIGNAL evaluates momentum conditions and outputs actionable signals. RISK validates every order candidate through a 14-step filter chain before it can proceed. EXECUTION submits cleared orders to the broker. MONITOR watches open positions for stop-loss breaches every cycle. ALERT dispatches notifications on risk events. OBSERVABILITY classifies and logs all agent events (OK / WARN / FAIL) for audit. Each card shows live running state and last activity timestamp.
Live portfolio state sourced from the broker API, broken down into cash and position components with a visual concentration view.
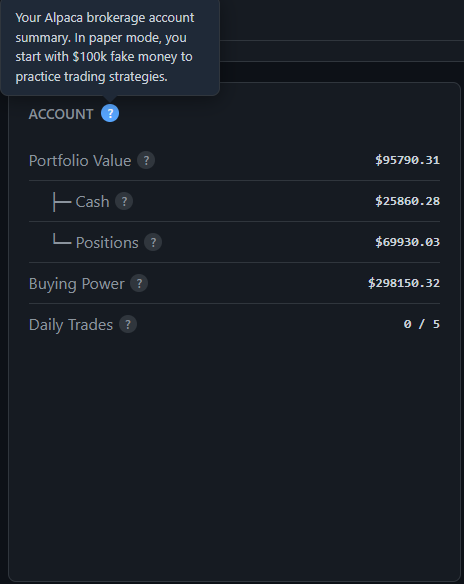
Pulled live from Alpaca on each polling cycle. Portfolio Value is the sum of cash and all open position market values. Buying Power reflects margin-adjusted available capital. Daily Trades tracks completed round-trips against the configured maximum — once the limit is hit, the execution pipeline stops accepting new buy orders for the rest of the session.
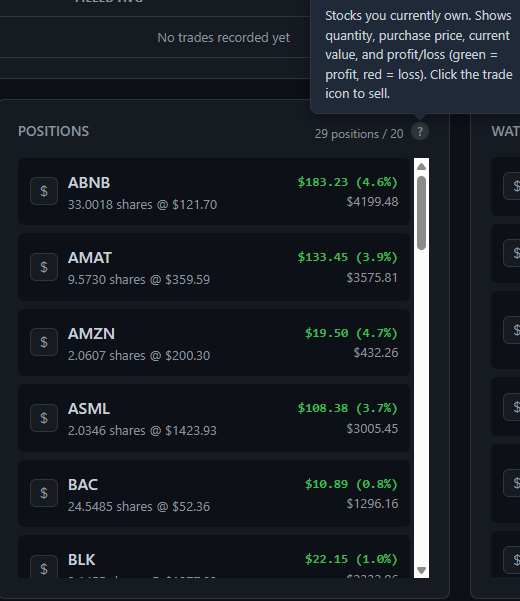
All current holdings with quantity, average entry price, unrealized P&L in dollars and percentage. Green = profitable, red = underwater. Each row has a trade button for manual intervention — useful during demo mode where auto-trade is disabled but the interface remains fully operational.
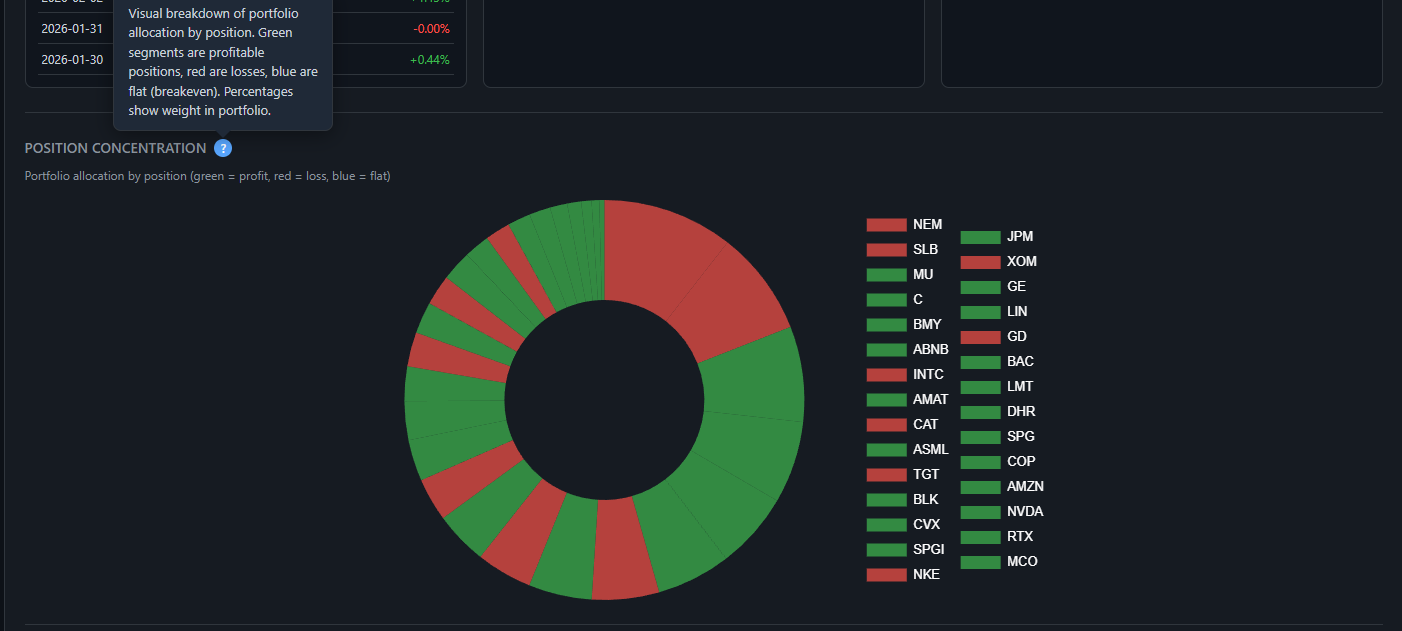
A donut chart visualizing portfolio allocation by position. Green segments are profitable positions, red are losses, sized proportionally by weight in the portfolio. This makes concentration risk immediately visible — a sector or single-name overweight that might be invisible in a list view stands out clearly in the chart.
The execution feed and signal queue — what the system traded and why.
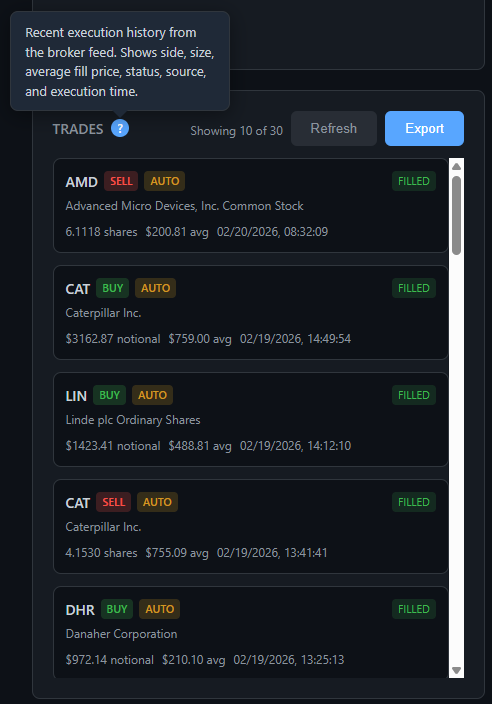
Execution history sourced directly from the Alpaca broker feed. Each entry shows ticker, direction (BUY / SELL), execution source (AUTO = algorithm-driven, manual otherwise), average fill price, notional value, and timestamp. The full list exports to CSV for external analysis. Showing 10 of 30 in this view — the full history is paginated and filterable by period.
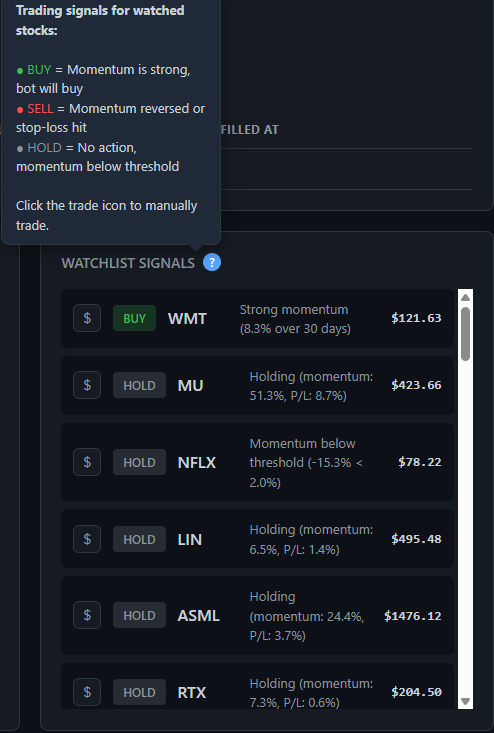
The Signal agent evaluates each watched symbol's 20-day momentum score every cycle and emits a classification: BUY = momentum exceeds the buy threshold; HOLD = within range but not a new entry; SELL = momentum has reversed through the sell threshold or stop-loss is hit. Each row shows the rationale — momentum %, P&L on existing position, and current price. Signals that pass downstream Risk checks enter the execution queue.
Every order passes through a multi-layer risk filter before reaching the broker. These controls are visible live and configurable without a restart.
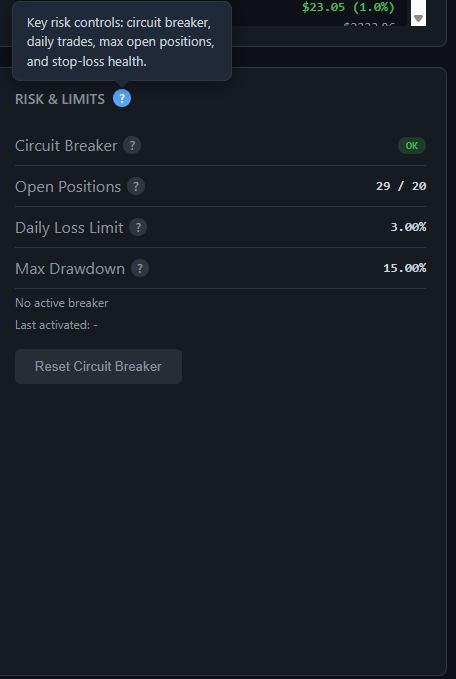
Live guard-rail status in one place. Circuit Breaker shows OK or TRIGGERED — when triggered, the execution pipeline halts and will not resume until the operator clicks Reset. Open Positions shows the live count against the configured maximum. Daily Loss Limit and Max Drawdown display the active thresholds — breaching either pauses new buys automatically.
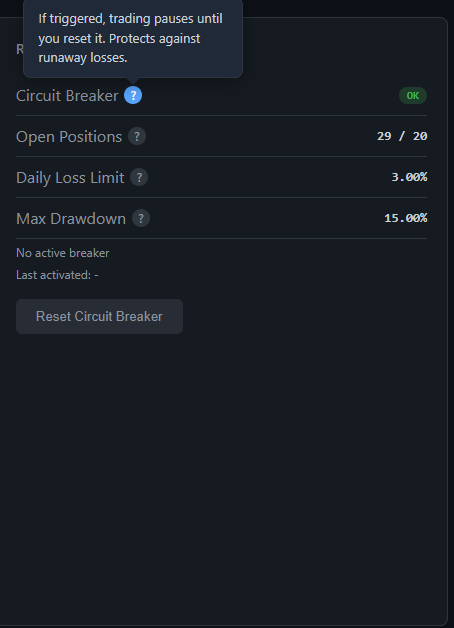
When triggered, trading pauses entirely and does not resume until the operator resets it. Designed for gap-down opens, high-volatility events, or any condition where continuing to trade would compound losses faster than the stop-loss can contain them.
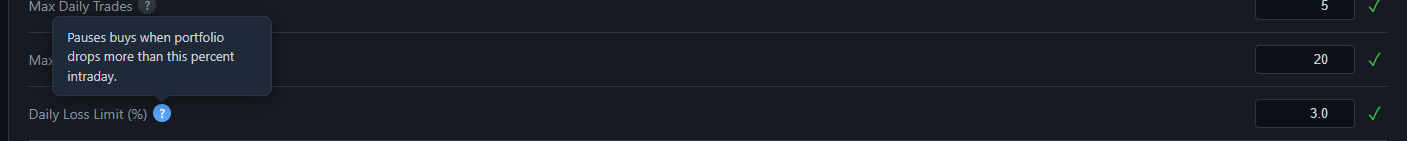
The Risk agent computes intraday portfolio change against the session's opening value on every evaluation cycle. If the threshold is breached, new buys are rejected for the remainder of the trading day — existing positions continue to be monitored for stop-loss.
Performance metrics derived from an on-disk equity snapshot store — independent of the live broker state and queryable across any time window.
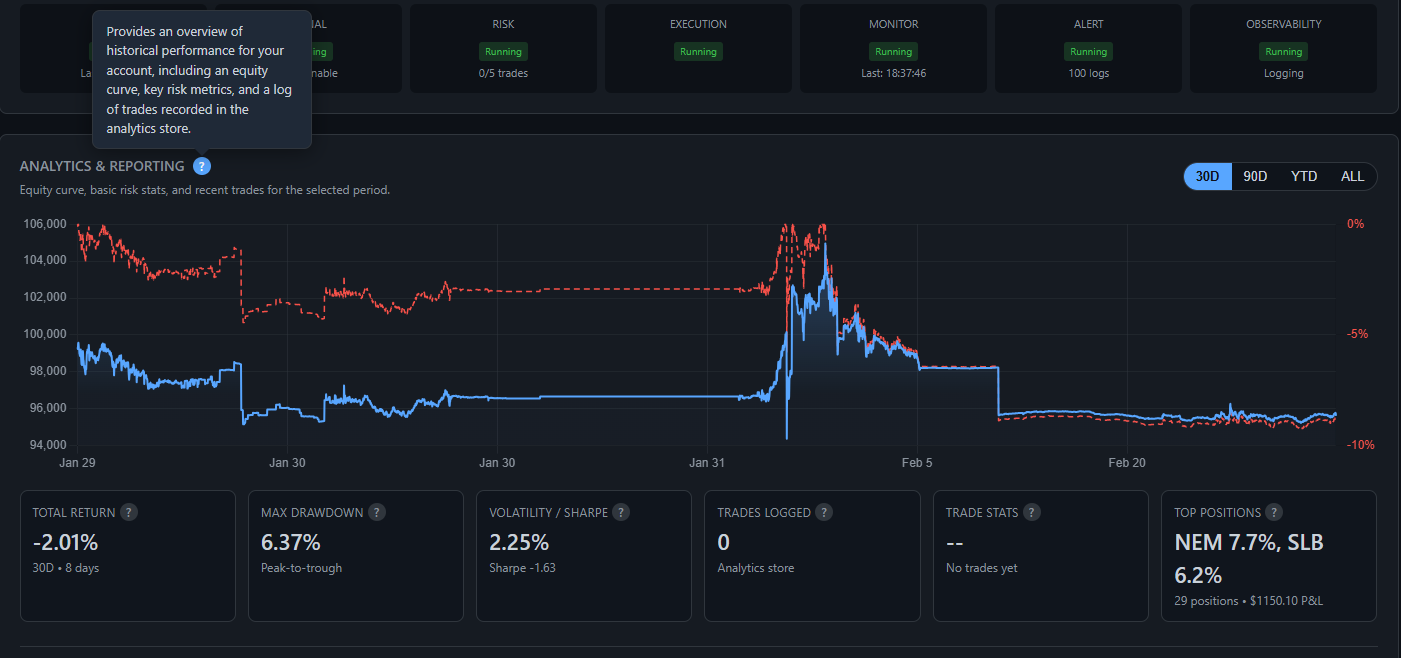
The equity curve (blue line) plots end-of-day portfolio value. The drawdown overlay (red dashed line, right axis) shows the percentage decline from each preceding peak — giving simultaneous visibility into absolute performance and downside risk without switching views. The summary row below the chart shows Total Return, Max Drawdown, Volatility / Sharpe Ratio, and Trade Stats for the selected period. The period selector (30D / 90D / YTD / ALL) dynamically filters the underlying dataset.
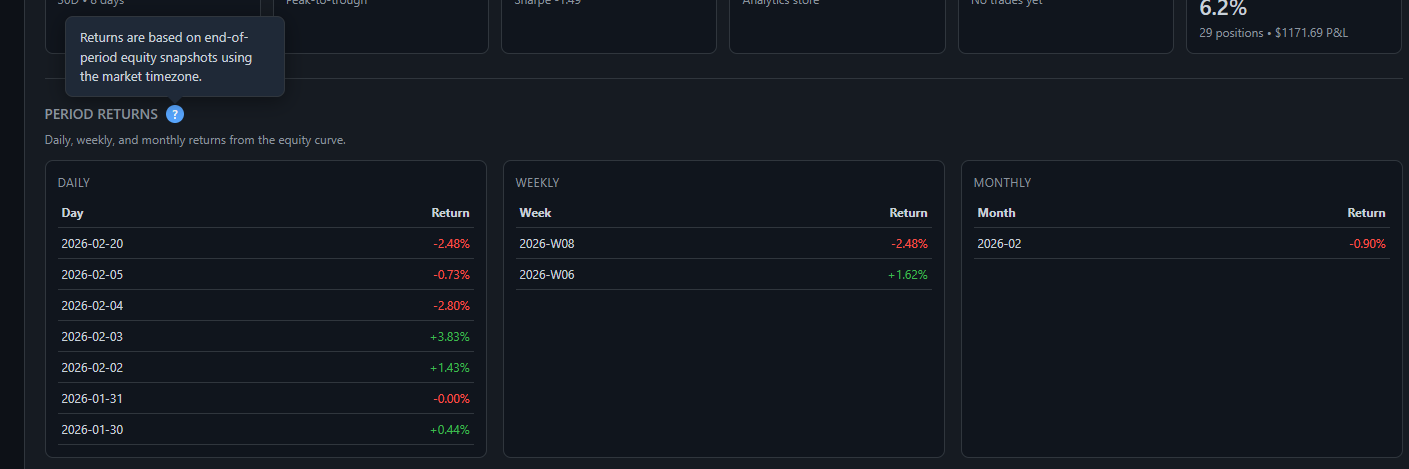
Daily, weekly, and monthly return tables computed from end-of-period equity snapshots — not from trade P&L calculations. This makes them an independent cross-check against the execution accounting. Each row is the percentage change from the prior period's closing equity value, bucketed in the configured market timezone.
All strategy and risk parameters are live-updatable through the UI. Changes apply to the running system immediately and persist across restarts via per-universe config files — no code changes, no redeploy.
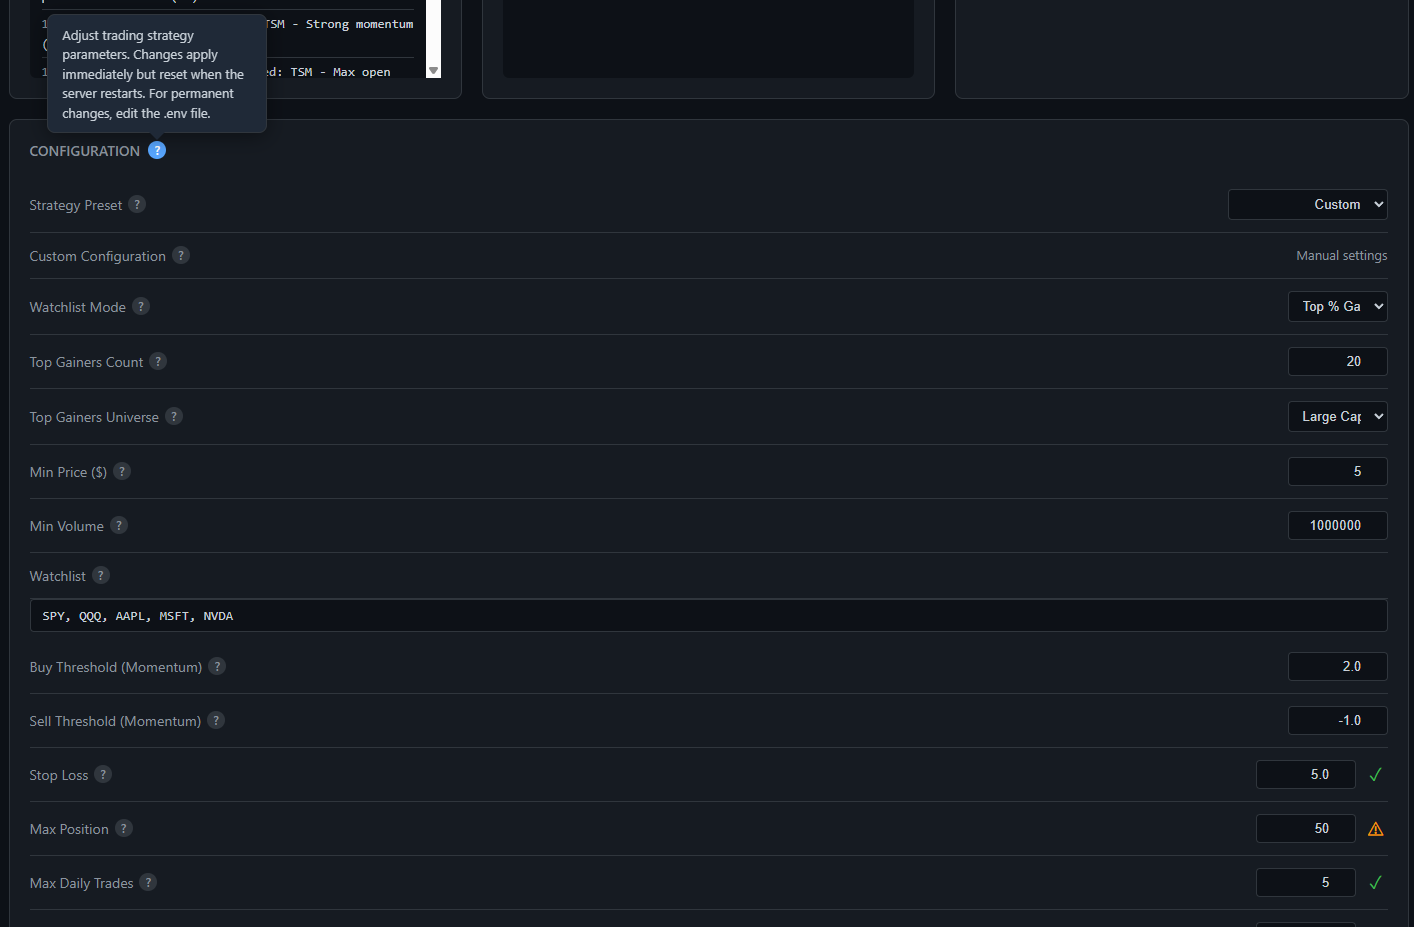
Strategy Preset selects a pre-tuned parameter bundle; Custom allows individual field overrides. Watchlist Mode controls the symbol universe — Top % Gainers (auto-populated daily from the momentum scan) or a manual watchlist. Top Gainers Count and Universe (Large Cap / All) refine the candidate pool. Below that: Buy/Sell momentum thresholds, Stop Loss, position sizing limits, Max Daily Trades, sector and correlation exposure caps, RVOL filter, and Trade Interval.
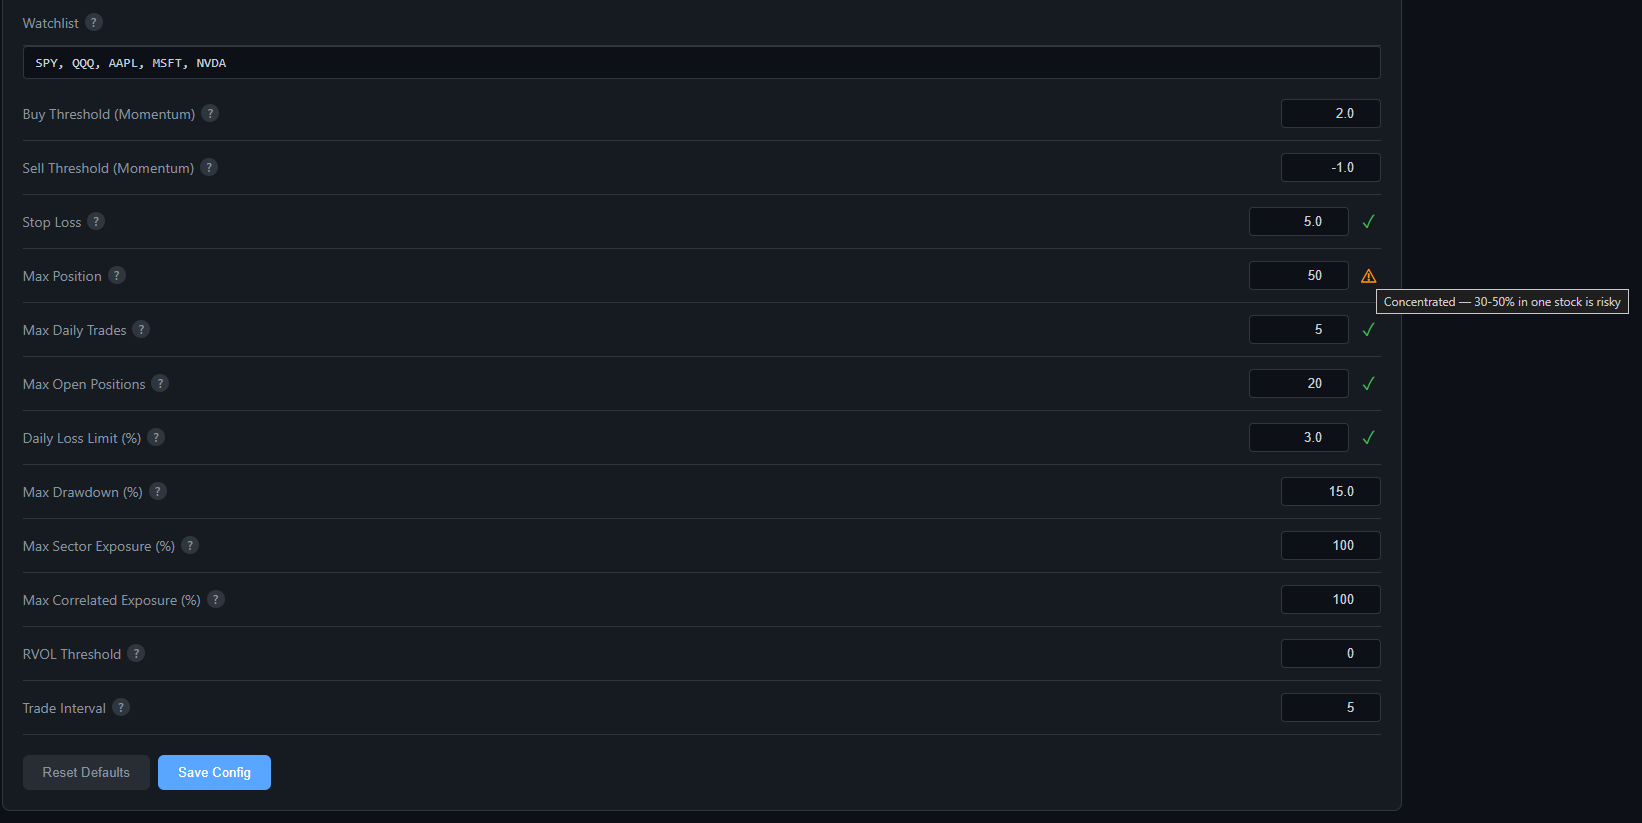
Config fields carry real-time safety indicators alongside each value. Green checkmark = within safe operating bounds. Amber warning = value is valid but operationally risky — the tooltip shown here flags a Max Position setting of 50% as concentrated: "Concentrated — 30-50% in one stock is risky." Validation runs client-side on every keystroke; the server enforces the same rules on save.
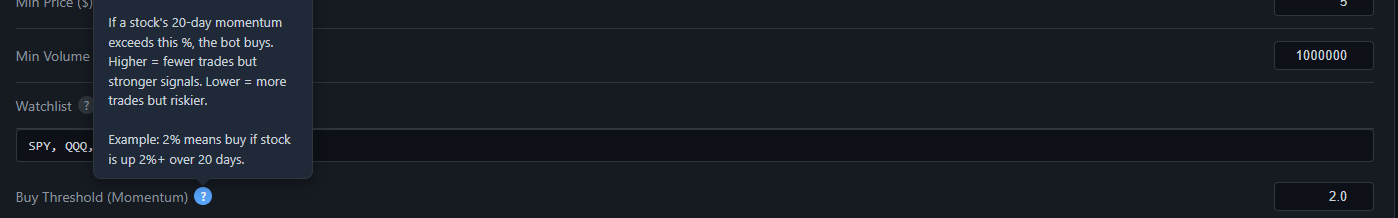
Minimum 20-day momentum % required to generate a BUY signal. Higher = fewer trades, stronger signals. Lower = more trades, higher noise. At 2.0, a stock must be up 2%+ over 20 days before the bot considers entering.
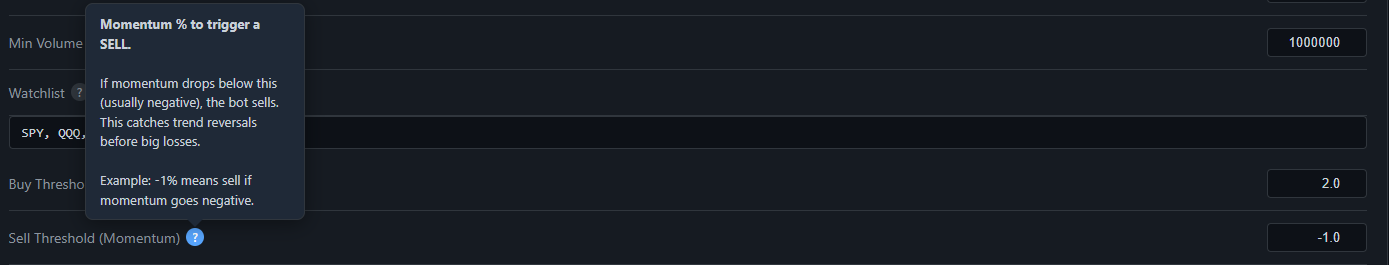
Momentum floor for exits. When a held position's momentum drops below this (typically a negative value), the Signal agent issues a SELL. Catches trend reversals before they compound. At -1.0, the bot exits when momentum goes negative.
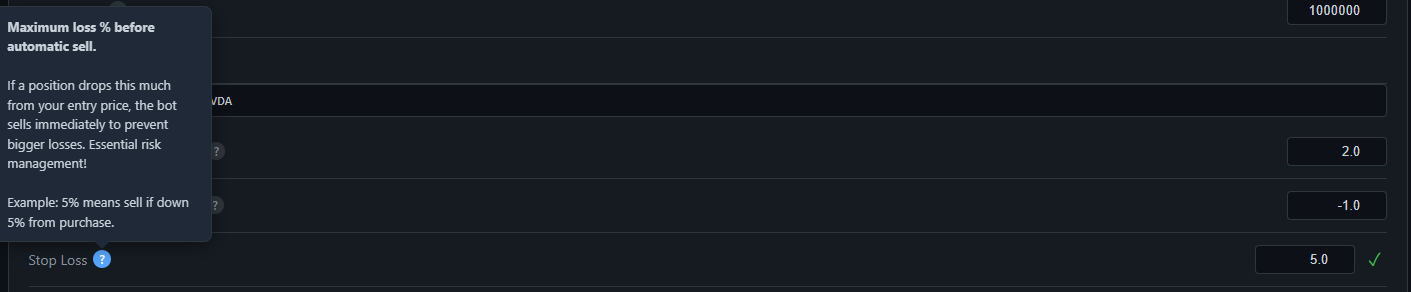
Position-level hard stop, enforced by the Monitor agent independently of signal state. If a position drops more than this % from entry price, a market sell is submitted immediately. At 5.0, any position down 5% from cost is closed without waiting for the next signal cycle.
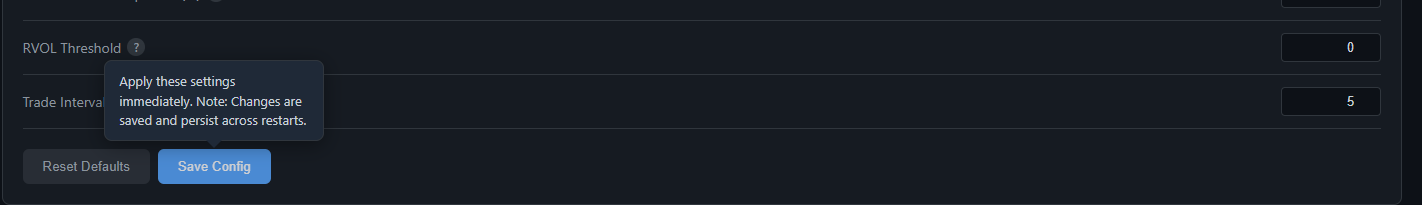
Save Config writes all fields to the universe-scoped config file and hot-applies them to the running system — no restart required. Reset Defaults reverts to the values from the environment file. Config state is isolated per universe (PAPER, LIVE, SIMULATION) so paper settings never bleed into live.